
Chapter Two: The Evidence Loop
Trust, integrity, and model validation through a closed accountability process that tests preserved forecasts against real-world outcomes.
Artificial intelligence can produce convincing financial analysis. But a sophisticated explanation is not validation, a plausible forecast is not evidence, and model confidence is not the same thing as demonstrated predictive reliability.
Trust should not be asserted by the model. It should be earned through evidence.
From Intelligence to Accountability
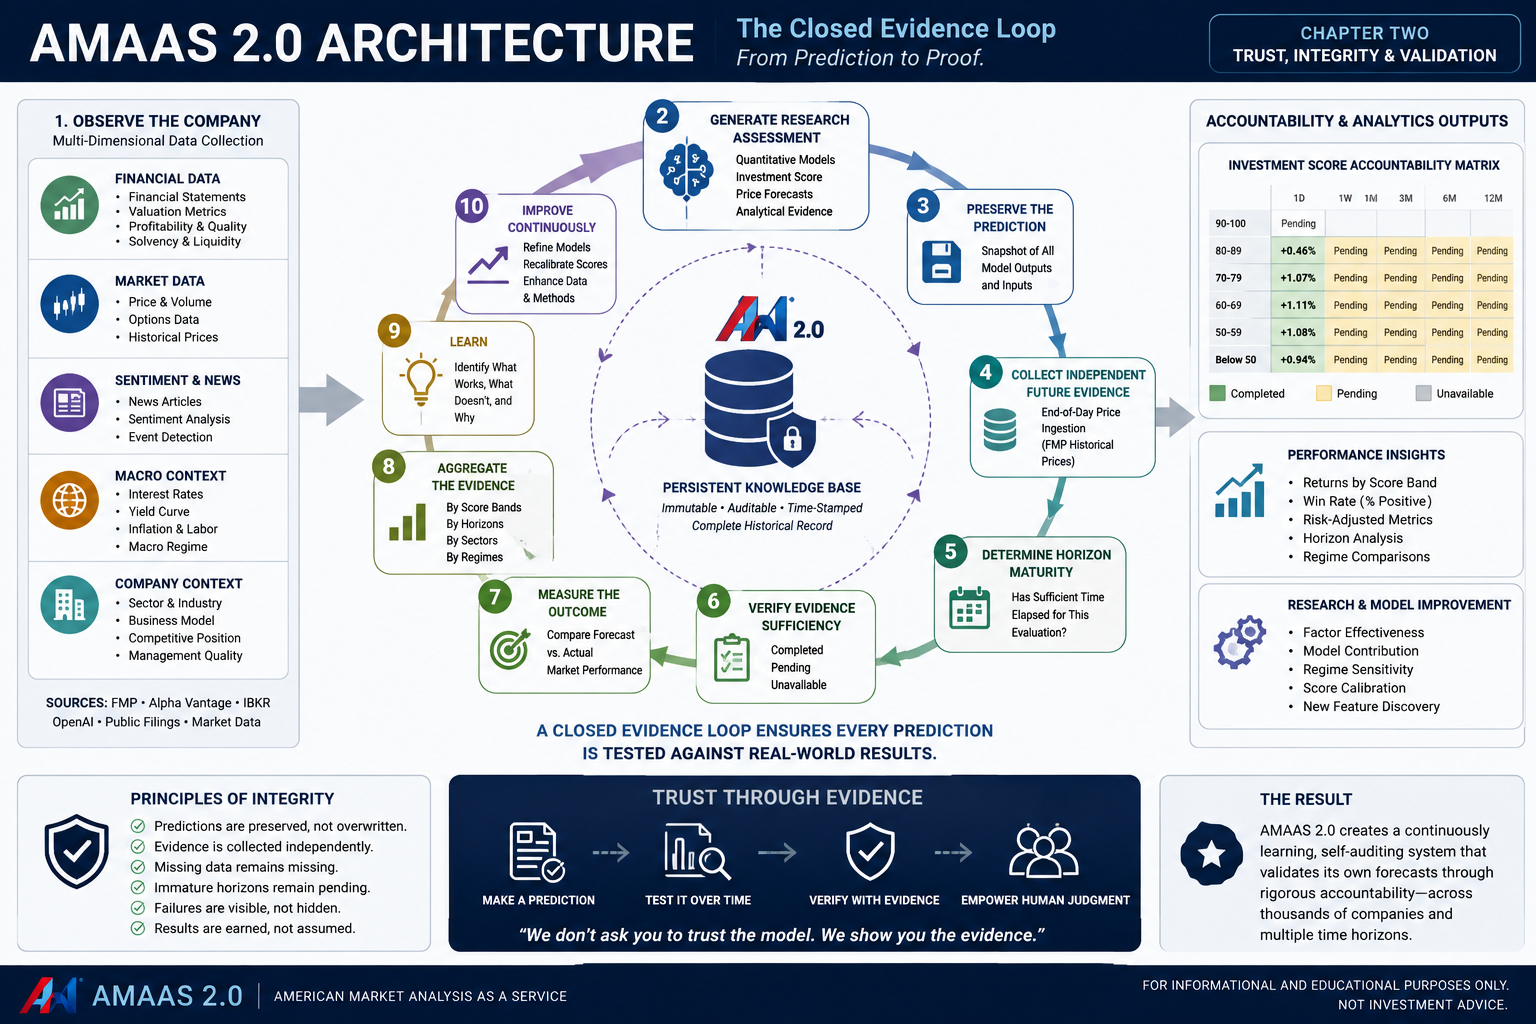
AMAAS 2.0 introduced memory. Historical research observations are preserved, forecasts become permanent records, independent market observations accumulate, and predictions eventually mature into measurable outcomes. The platform can therefore answer a question every analytical system should eventually face: What happened after you made the prediction?
The Accountability Baseline
Formal forecast accountability begins with the August 2, 2026 research dataset containing 4,349 company snapshots and six future evaluation horizons: 1 day, 1 week, 1 month, 3 months, 6 months, and 12 months.
4,349 company snapshots × 6 horizons = 26,094 potential forecast outcomes
Collecting and Verifying Independent Evidence
A research snapshot records what AMAAS believed at a point in time. Persistent price observations record what subsequently occurred in the market. End-of-day prices are stored in the AMAAS 2.0 database so accountability, portfolio history, event intelligence, and research history can rely on durable evidence.
During an August 5 scheduled run, price ingestion terminated before normal completion. AMAAS did not continue as though the data were complete; forecast evaluation was skipped. After the ingestion was rerun successfully, accountability evaluation reconciled every expected outcome into completed, pending, or unavailable states.
Company snapshots:     4,349
Evaluation horizons:       6
Potential outcomes:    26,094

Completed:              3,851
Pending:               21,373
Unavailable:              870
                       ------
Total:                 26,094
Testing the Investment Score
The accountability system turns the Investment Score into a falsifiable hypothesis. Companies are grouped into score bands and subsequent performance is measured across increasingly meaningful horizons using sample size, median return, average return, and positive-return frequency.
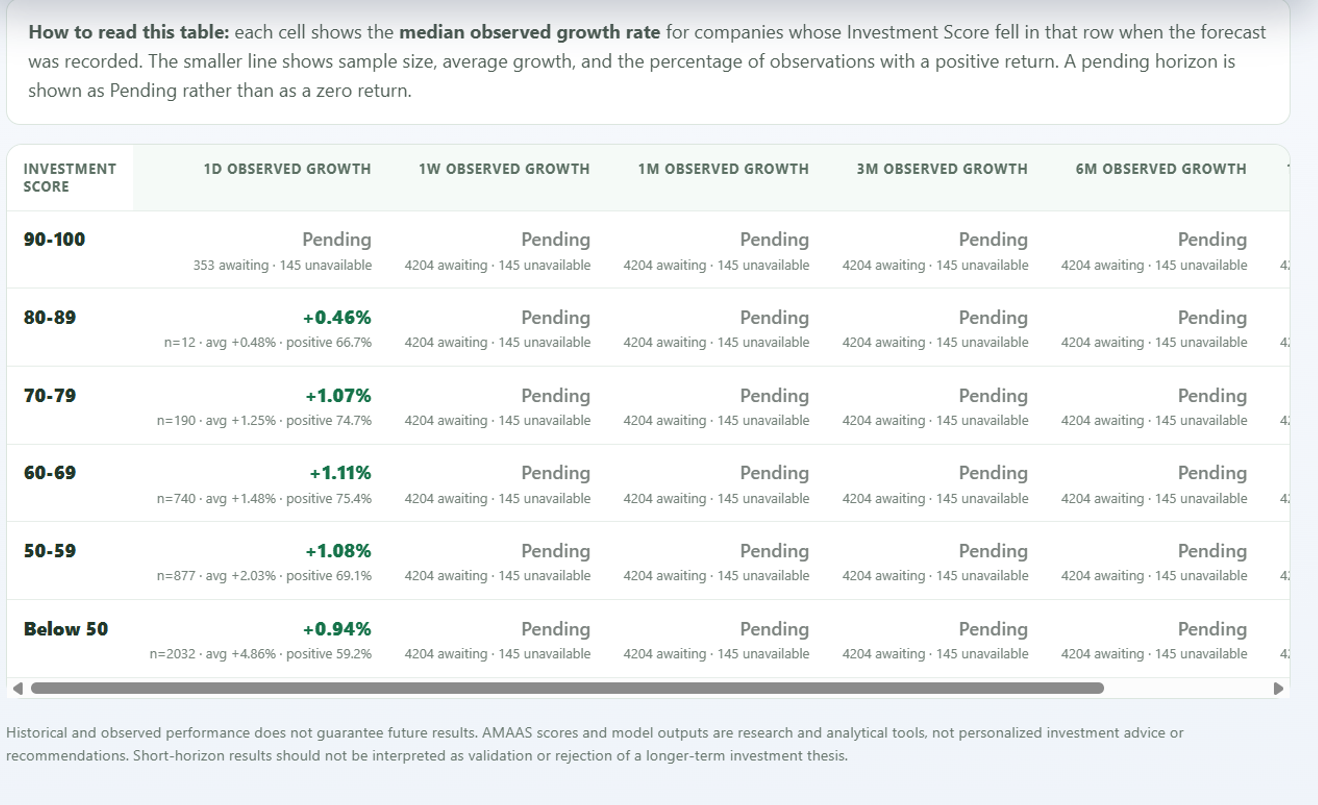
Validation Is Not Confirmation
Confirmation asks whether we can find evidence that AMAAS works. Validation asks what the evidence says about whether AMAAS works. If the evidence contradicts the original hypothesis, the platform should investigate the model rather than hide the result.
The model now has to face its own historical predictions.
The Experiment Has Begun
Most of the accountability matrix still says Pending. That is exactly what it should say. The market will provide the evidence, and AMAAS will keep the record.
Historical and observed performance does not guarantee future results. AMAAS scores and model outputs are research and analytical tools, not personalized investment advice or recommendations.